Quick-yet-polished timelines for grant applications
Part two of my series on low-effort, high-reward graphics for grant proposals, this time focusing on timeline charts.

Question:
I make all the figures for my grant applications in PowerPoint, but I’ve heard that some applicants for the big grants hire graphic designers and science illustrators. Are good visuals becoming make-or-break in research grants? Even if I’m not proposing multi-million-dollar projects?
– Anonymous, Rehabilitation Sciences
Dr. Editor’s response:
I provided the first part of my answer to this question, on images, in last month’s piece; this month, I want to do a deep dive into timelines, again with reference to real examples from grant applications shared in the Open Grants database. You can also grab my timeline template bundle for free, so you can quickly adapt an existing model for your next grant application.
Let’s start by looking at some examples of timelines used in successful applications to U.S.-based funding agencies – sadly, there are only a few Canadian samples in Open Grants – and considering what features you might include in your own grant applications.
1. Demonstrate the feasibility of your proposed work
Timelines are important in grant applications in part because they attest to feasibility. By demonstrating that you understand and have planned for the discrete steps necessary to accomplish ambitious objectives, your timeline can help to persuade reviewers that your project can indeed be completed in the years you’ve allocated for it.
See, for example, this simple gantt chart timeline from the funded proposal “Collaborative Research: Submesoscale-Resolving Large Eddy Simulations Using Reduced Biogeochemical Models”:
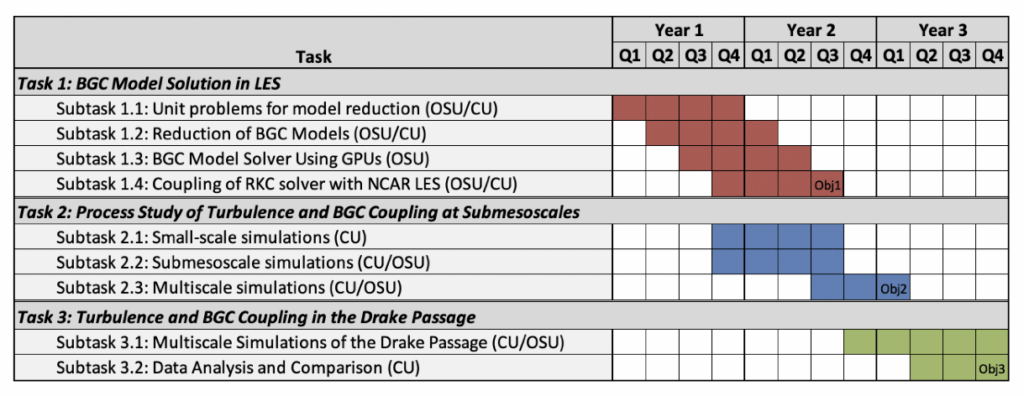
This interdisciplinary and inter-institutional project was awarded over half a million U.S. dollars. Their timeline:
- algins with the tasks and subtasks identified in the methods section of the proposal;
- identifies the institution—Colorado University (CU) and Ohio State University (OSU) – responsible for achieving each subtask; and,
- shows at what point in the three-year funding period each objective will be achieved
This more compressed gantt-style timeline comes from a successful proposal to NASA, titled “Butterfly: A Satellite Mission to Reveal the Oceans’ Impact on our Weather and Climate.”

While the applicants would have needed to be careful to ensure that the many acronyms included in this timeline are comprehensible to their readers, their timeline’s ability to concisely convey both project phases and key milestones for progress helps to make the image convincing. If I had edited this grant, I would’ve tried to make the columns for each year consistent in their sizing – to my eyes it is confusing that the eight-month pink bar is the same length as the 24-month yellow bar – but other than that small quibble, I think this graphic does a great job of packing a lot of detail into a small amount of space.
Other options for details you could visualize in a gantt chart include:
- the time it takes to apply for and receive ethics approval;
- the dates of advisory committee meetings, conference presentations, or other key events;
- the timing of particular milestones or completed outputs; and,
- planned knowledge mobilization and dissemination activities.
When I make gantt charts, I usually create them in Microsoft Word, using the “table” function to create neat rows and columns, and the “shading” effect to create the bars of colour. I’ve provided three Word gantt charts for you in my timeline template bundle.
One alternative to Word is the popular design platform Canva, which includes both free and paid gantt chart templates, such as this one:
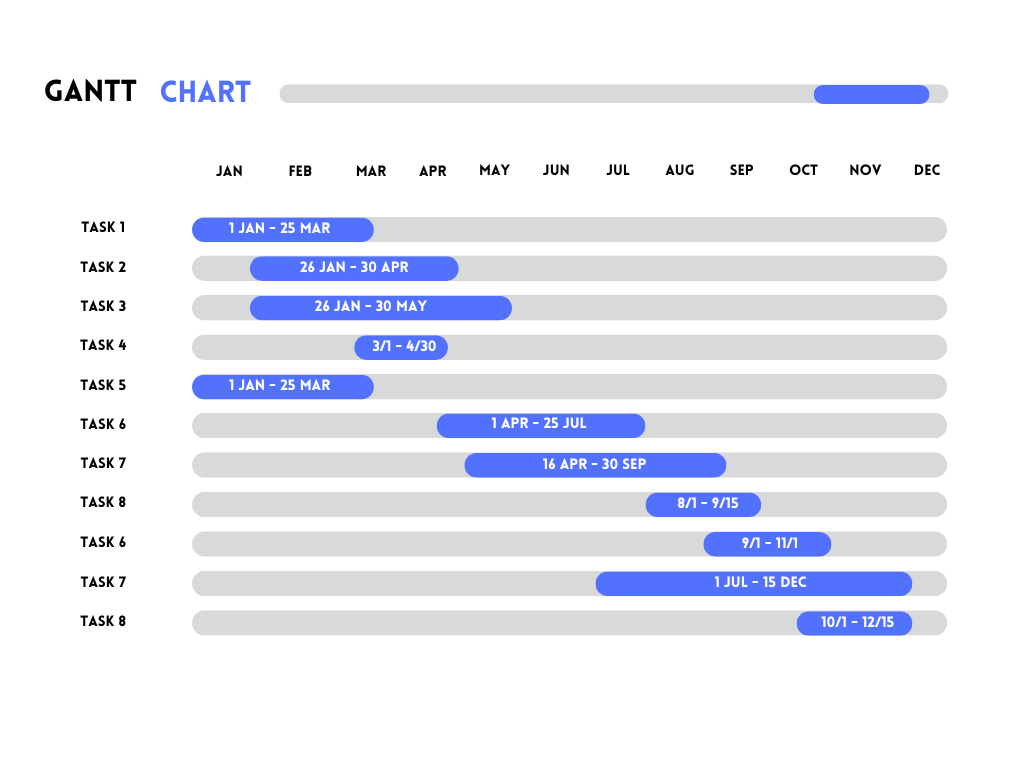
Unfortunately, these timeline templates don’t tend to be created with the space constrictions of grant applications in mind – which is to say that they often feature a lot of white space. The above gantt chart is wonderfully clear, but most researchers will need more space than it allocates to describe their tasks, and so would need blue bars that are substantially more compressed than are provided here. I’d also suggest that the gaps between lines is too large and the months would need to be moved much closer to the start of the chart.
2. Align with the evaluation criteria
The National Institutes of Health (NIH) and National Science Foundation (NSF) both ask applicants to articulate their project’s “broader impacts” – that is, the potential significance and resonance of their work beyond traditional knowledge dissemination. In both of the below NSF-funded projects, the applicants ensured that they accounted for activities that contribute to their projects’ “broader impacts” in their timelines:
“Effects of rapid evolution on alternative community states at multiple spatial scales”:
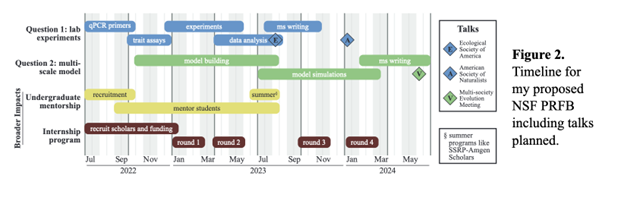
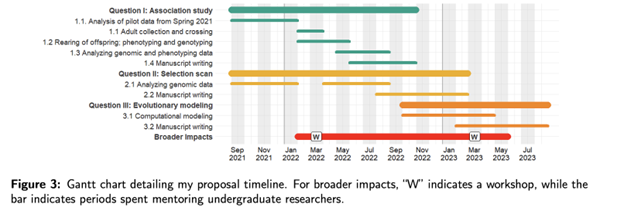
By including their “broader impact” activities in their timelines, both of these NSF applicants demonstrated that they’ve considered the time that they will need to dedicate to achieving their “broader impact” goals, and have accounted for this time in their project planning.
In my opinion, neither of these timelines are perfect. They both contain more visual clutter than is strictly necessary, with vertical bars that divided each grey- or white-coded month into two, and, in the case of the second of the two gantts, the thick coloured bars show the duration dedicated to each question, repeating information that is already sufficiently visualized through the use of colour. With less visual clutter, a similar timeline might look like this:

Nonetheless, in my opinion, using key terms from evaluation criteria within your timeline is an excellent idea. For example, if you’re applying for a SSHRC Insight Development Grant – an application that requires a separate one-page timeline – you could visualize activities that related to the following evaluation criteria:
- “Quality of training and mentoring to be provided to students, emerging scholars and other highly qualified personnel, and opportunities for them to contribute”;
- “Probability that the objectives will be met”; and,
- “Quality and appropriateness of knowledge mobilization plans, including for effective dissemination, exchange and engagement with stakeholders within and/or beyond the research community, where applicable.”
Finally, when you have a particularly large budget item – the creation of a specific knowledge mobilization output, or attendance at an international conference – I definitely suggest referencing that budget item in your timeline to show how it fits as a part of the whole, and to demonstrate that it is preceded by the necessary preparatory steps to ensure it is successful.
3. Reinforce the priorities of the planned work
Finally, if you create a timeline that takes a different form than the gantt charts and gantt chart variations depicted above, you can use this component of your application to reinforce the importance of, say, ongoing development or community engagement in your work.
Consider, for example, this unconventional timeline:
I can imagine this timeline working well to visualize a project that begins with a prototype that is iteratively developed over time, perhaps through rounds of consultation.
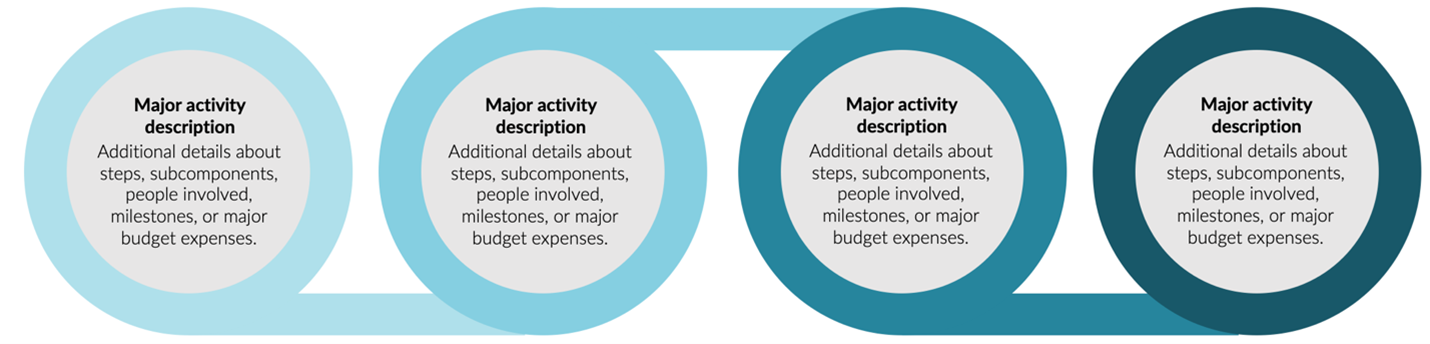
In contrast, if I were writing an application for seed funding to develop the prototype that might be tested and iteratively developed in the process visualized above, I might create a timeline that looks more like this:

This timeline suggests that future iterations of the design and development cycle are forthcoming, and that the funding being applied for in the proposed project will be used to create something that is almost whole, or close to functional, as it is almost a full circle.
Finally, if I were proposing a research project in which I wanted to work with a community that doesn’t perceive time as linear, as do Western, European and Euro-descendant cultures, I might visualize my research activities as a circle:
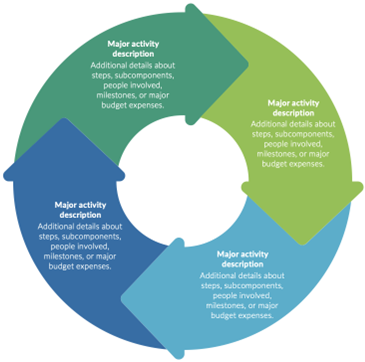
I can imagine this timeline as being particularly well-suited to a project that involves repeated cycles of data collection, analysis, evaluation and sharing, in which each part of the process draws from and feeds into the next. For example, the dark blue arrow might indicate attendance at an event in which you share knowledge. Participants could check the veracity of the analyses that you’ve performed earlier (pale blue arrow), and provide additional details that then serve as a data collection (dark green arrow).
To return to your original question, dear letter-writer, while you may not need to hire a graphic designer to create a timeline for your next CIHR Project or SSHRC Insight grant, I do nonetheless encourage you to create visuals that speak to the feasibility of your project – not just your methods, but also your proposed training and knowledge-sharing activities, as well as any milestones, outputs, activities, achievements, or events that constitute a substantial percentage of your budget request.
To make your life easier, I’ve developed a free timeline template bundle that includes gantt chart templates in Microsoft Word and PowerPoint templates for all the timelines included here, as well as a few extras that didn’t fit in this month’s column. Want my help with your next grant application? You can also hire me for one-on-one support – many researchers use their start-up or professional development funds to pay for my time – or email your research office to ask them to put me on their roster for grant reviews.


Featured Jobs
- Director of the McGill University Division of Orthopedic Surgery and Director of the Division of Orthopedic Surgery, McGill University Health Centre (MUHC) McGill University
- Marketing - Faculty Position, Tenured or Tenure TrackUniversity of Alberta
- Vice President, Finance & AdministrationOCAD University
- Canada Impact+ Research ChairInstitut national de la recherche scientifique (INRS)
- Health Sciences - Assistant ProfessorSimon Fraser University
More from Career Advice
-

Heading to France for your master’s?
Quebec’s Bourse Frontenac could help fund your graduate studies.
-

Bridging science and inclusion
MISI Summer School reimagines equity in research training.
-

Take it easy this conference season
Before committing to a colloquium, consider carefully whether the time and cost are worth the payoff.
-

How to write an effective service statement for your promotion and tenure dossier
Go beyond “bum-in-seat” accounting to emphasize your expertise and accomplishments.
More from Advice
-

Administration calls. Should you answer?
The pros and cons of taking on admin roles in different stages of your career
-

Universities must appeal to non-traditional students
Meeting mid-career education needs is win-win for non-traditional students and academic institutions.
-

From marketer to MFA
How I returned to graduate school as a working professional.
-

How to get the most out of your sabbatical
Detailed planning keeps you on track toward your goals.
More from Ask Dr. Editor
-

How to craft a strategic research statement
Identifying themes in your work history can help you move from a laundry-list to a compelling story.
-

Documenting your work for promotion and tenure
Setting up a filing system now is a gift to your future self.
-

Understanding research-creation at SSHRC
Artistic works that explore socio-cultural questions may qualify for this unique grant.
-

Writing a successful narrative CV
A guide and template to help you ace the upcoming Tri-Agency curriculum vitae.
Post a comment
University Affairs moderates all comments according to the following guidelines. If approved, comments generally appear within one business day. We may republish particularly insightful remarks in our print edition or elsewhere.