Women’s representation and compensation in full-time faculty positions
A statistical analysis of Canadian universities from 1970 to 2022.

Women’s representation in the university sector in Canada has significantly increased over the past several decades. However, despite these gains and the fact that women comprise the majority of university graduates, women are still underrepresented in academia.
This article looks at more than 50 years of data to document how women’s representation in full-time faculty positions at Canadian universities has evolved over time. It also explores gender differences in salaries (the gender “pay gap”) and highlights the extent to which women continue to be underpaid relative to men.
This analysis is based on detailed computations from Statistics Canada’s University and College Academic Staff System (UCASS) dataset, from 1970 to 2022. The UCASS collects anonymized, national comparable data on the number and socioeconomic characteristics of full-time academic teaching staff at Canadian universities produced from administrative payroll data.
Overall representation of women in academia
The per cent of full-time faculty positions across all academic ranks held by women has increased from about 12 per cent in 1970 to 42 per cent in 2022, as shown in figure 1-A.
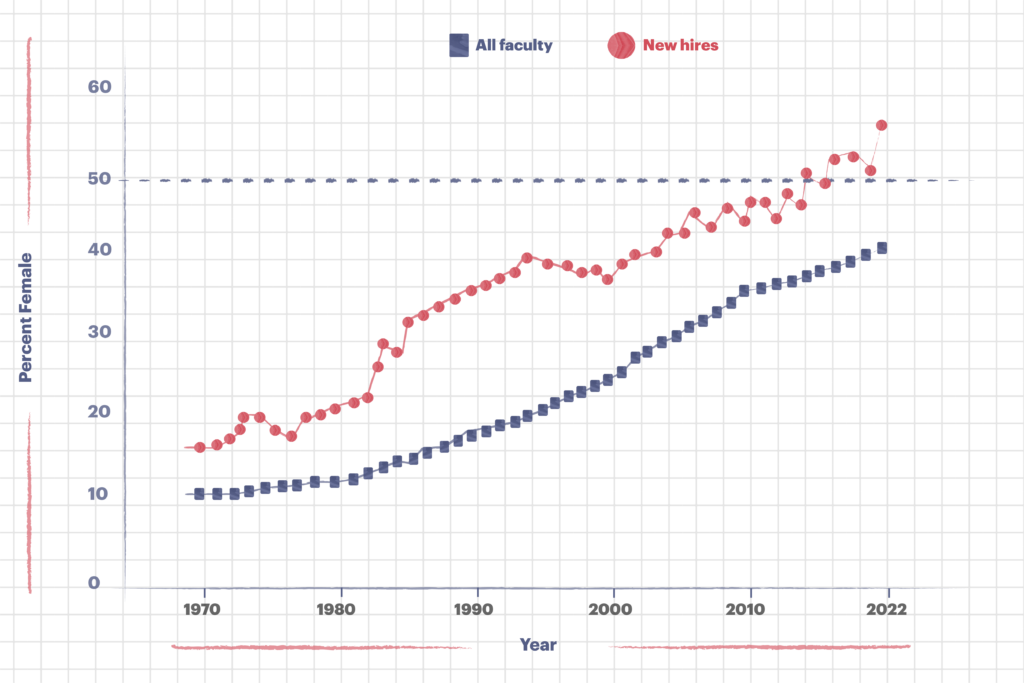
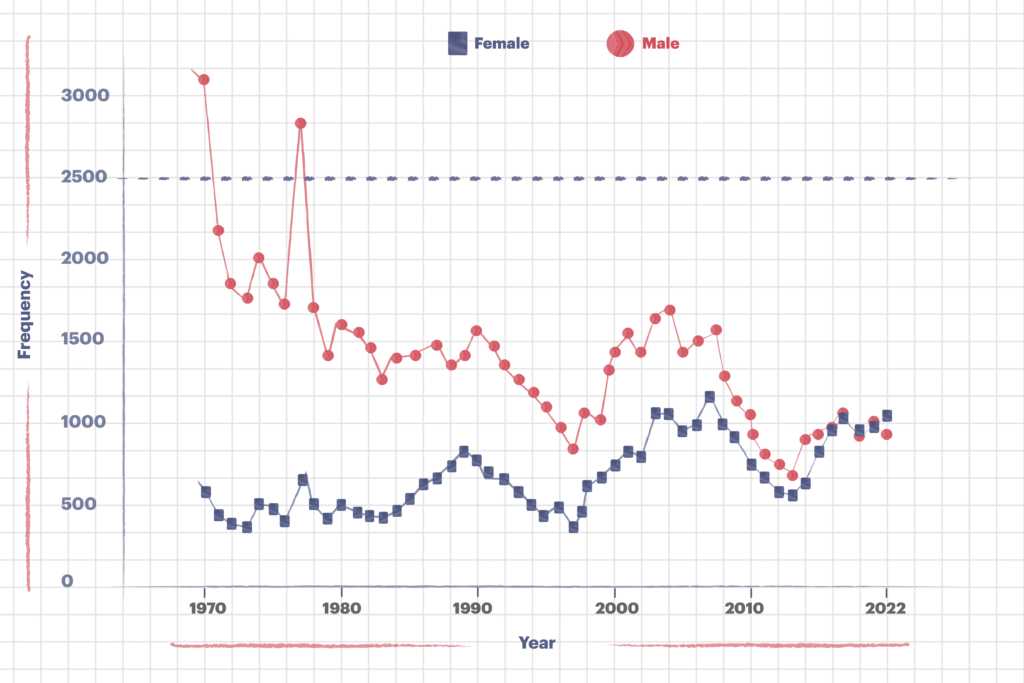
Figure 1: Overall representation of women
Most of these gains were realized during the 1990s and 2000s, which posted increases of eight percentage points per decade. By comparison, the per cent of full-time faculty positions held by women increased by one per cent during the 1970s and by six per cent since 2010.
The overall gender composition reflects both current and past recruitment and retention practices. Focusing on the gender composition of new hires offers greater insight into current practices. Figure 1-A shows that the per cent of new hires who are women was also below parity through most of the sample period and reached 50 per cent for the first time as recently as 2017.
While the per cent of women has trended upwards over time, much of this gain can be attributed to a slowing of the recruitment of men rather than solely to an increase in the recruitment of women, as shown in figure 1-B. For example, an average of about 480 women and 2,070 men were hired each year during the 1970s, compared to about 590 women (+23 per cent) and 1,000 men (−52 per cent) during the 1990s. Only in the past few years has total recruitment returned to the historical average (about 2,000 per year) with roughly an equal distribution of men and women.
Rank and promotion
The overall distribution of men and women in faculty positions across all ranks masks the larger differences that exist within academic rank.
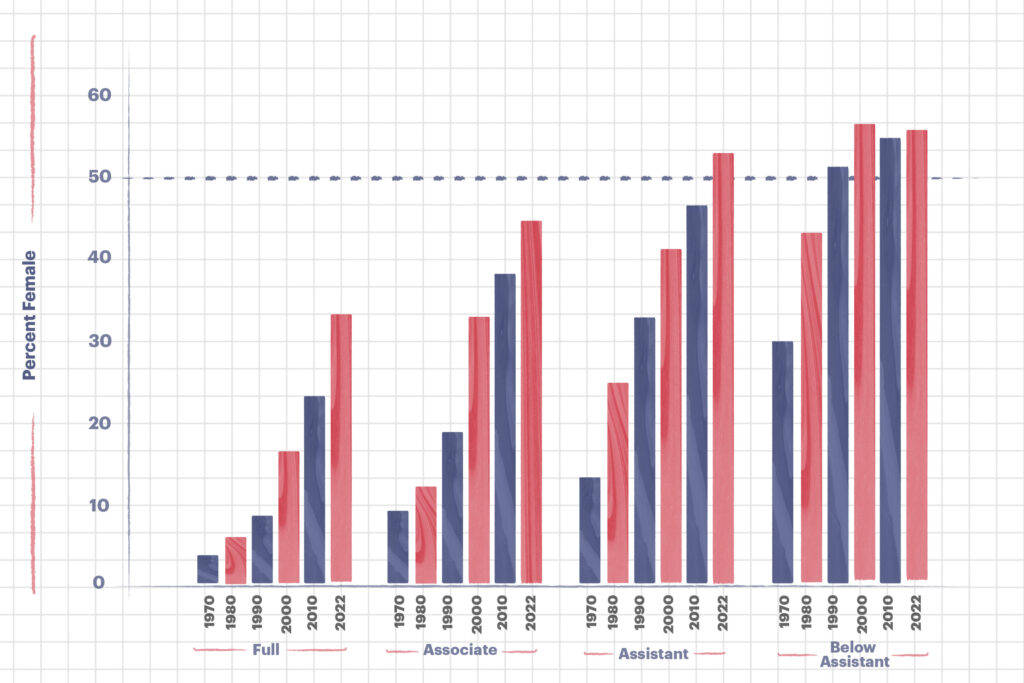
Figure 2: Women’s representation by rank
Women have been slightly over-represented in full-time teaching faculty positions at a rank below assistant professor (55 per cent to 57 per cent) for the past two decades, as shown in figure 2. This trend could potentially reflect, at least in part, a gender difference in the conversion of non-tenure-track teaching positions into tenure-track faculty positions.
Due to the increase in women among new hires over the past few years, the per cent of women at the rank of assistant professor finally reached parity a couple of years ago.
At the higher ranks of associate and full professor, women remain significantly under-represented. The per cent of women in these ranks were 42 per cent and 32 per cent in 2022, respectively. A silver lining is that women’s representation in these tenured ranks have been increasing over time and may continue to increase as younger faculty move through promotion and tenure.
The extent to which women are underrepresented in tenured faculty positions also maps into an underrepresentation of women among faculty members who hold administrative responsibilities. Equal representation among administrators can be important to help combat gender discrimination in other areas such as hiring, promotion and tenure decisions.
The responsibilities observed in the data include: dean; assistant, associate or vice dean; chair, director or head; and assistant or associate to the chair, director or head. Senior administrative positions (e.g. president, vice-president, provost) are not observed.
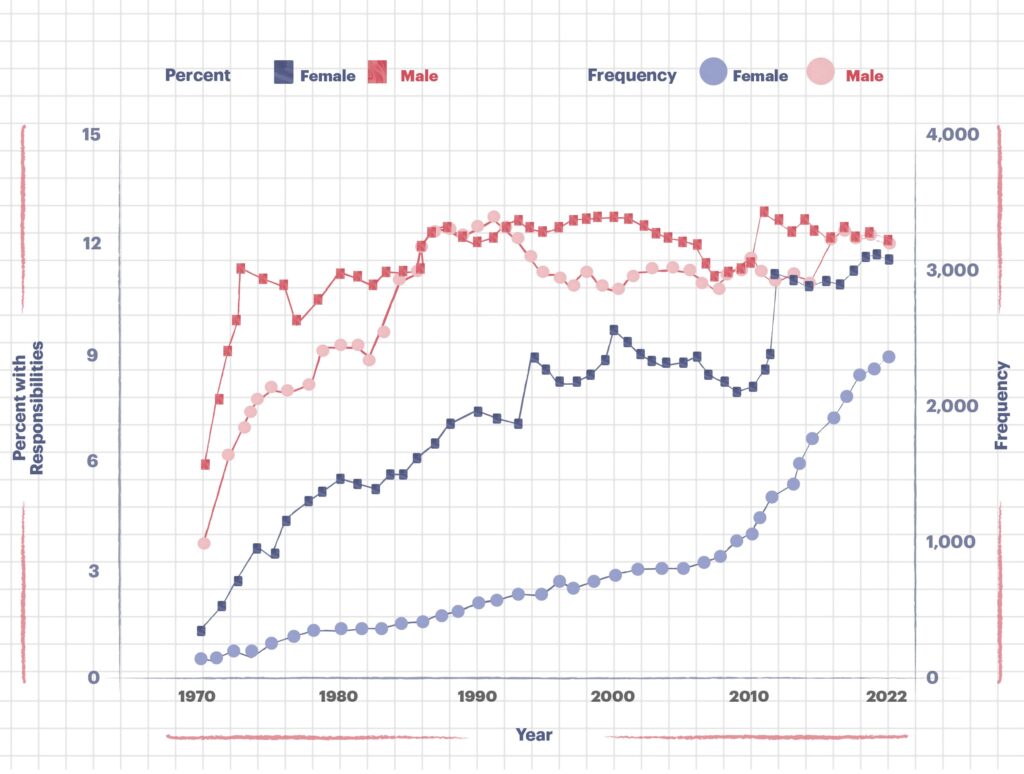
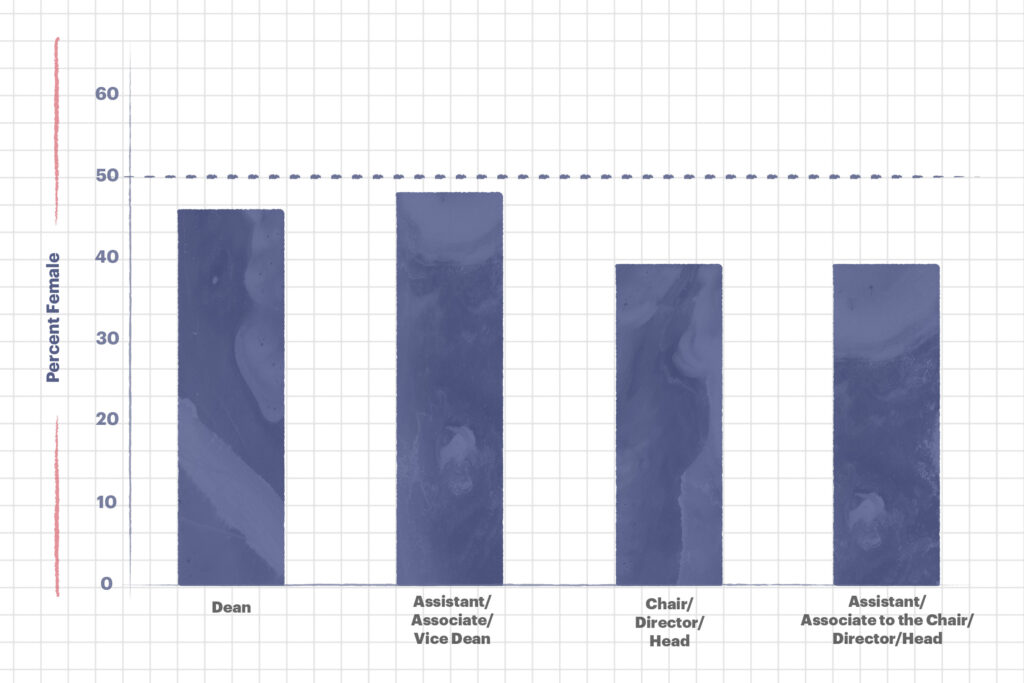
Figure 3: Women’s representation among those with administrative responsibilities
In figure 3-A, the solid dots show the proportion of men who have administrative responsibilities expressed relative to the total number of men (in red), and the per cent of women who have administrative responsibilities expressed relative to the total number of women (in blue). The data show that men have been historically more likely to be in administrative positions than women even after controlling for the fact that there are more men than women to fill these positions.
These percentages have converged only in the past few years. However, because there are more men than women in faculty positions, these trends also imply the majority of positions with administrative responsibilities remain filled by men. The hollow dots in figure 3-A show that the number, or frequency, of men who have administrative responsibilities has increased to about 3,315 in 2022 (in red), whereas the number of women who have administrative responsibilities reached 2,285 in 2022 (in blue), less than 70 per cent as many as men.
Figure 3-B shows that, in 2022, the gender gap in administrative responsibilities was the largest at the levels of chair, director or head (39 per cent female) and assistant or associate to the chair, director or head (38 per cent female). A slightly high per cent of women filled dean positions (45 per cent) and the per cent of women in assistant, associate and vice dean positions was very close to parity (49 per cent).
Field of study
How women’s representation has evolved over time in science, technology, engineering and mathematics (STEM) fields compared to the business, humanities, health, arts, social science and education (BHASE) fields is illustrated in figure 4. Since a change in hiring practice is a precursor to changing a workforce composition, the analysis is repeated separately for all faculty and new hires.
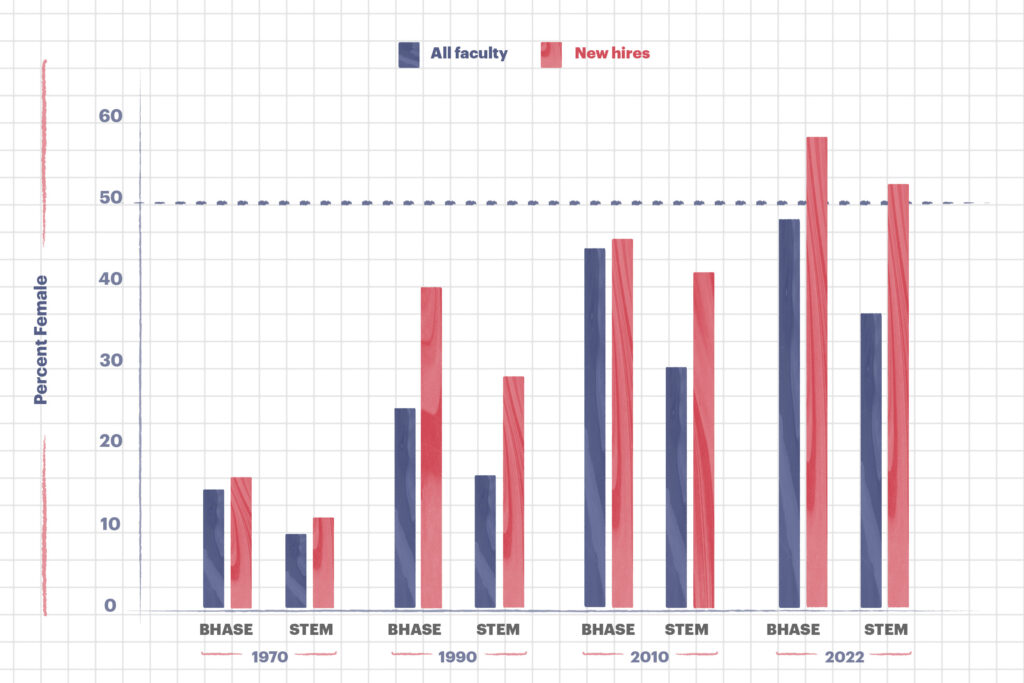
Figure 4: Women’s representation by field of study
Women’s representation in STEM fields has remained structurally below that of other fields over the full sample period. In 2022, women comprised only 37 per cent of all faculty in STEM fields compared to 48 per cent of all faculty in BHASE fields (11 percentage points).
This gap of about eight to 12 percentage points has remained stable since the 1990s.
Women’s representation among new hires in STEM fields (52 per cent) is also lower than that of BHASE fields (59 per cent). This difference could reflect discrimination in hiring as well as differences in fields of study chosen by men and women when they were students. For example, the number of women in engineering programs has increased over the past few decades but parity is still a long way off. The fact that women comprised slightly more than 50 per cent of all new hires in STEM for the first time recently is a promising finding. If this trend continues, it could have wider implications for addressing gender gaps in field of study and occupational choices.
Gender pay gap
A persistent feature of the Canadian labour market is that men earn more than women performing comparable jobs. For example, Statistics Canada reports that Canadian-born women earned an average hourly wage 9.2 per cent less than their male counterparts in 2022.
Figure 5-A plots estimates of the gender pay gap over the sample period. The following analysis is based on a measure of base annual salary. Base salary reflects the annual pay as specified in the employee’s contract with the employer (e.g., the rate of pay specified at a point on a pay scale in a collective agreement, if one exists). Salaries are expressed in 2022 constant dollars to adjust for the effects of inflation on the value of a dollar. Further details about the methodology for estimating the pay gap is provided in Baker et al.
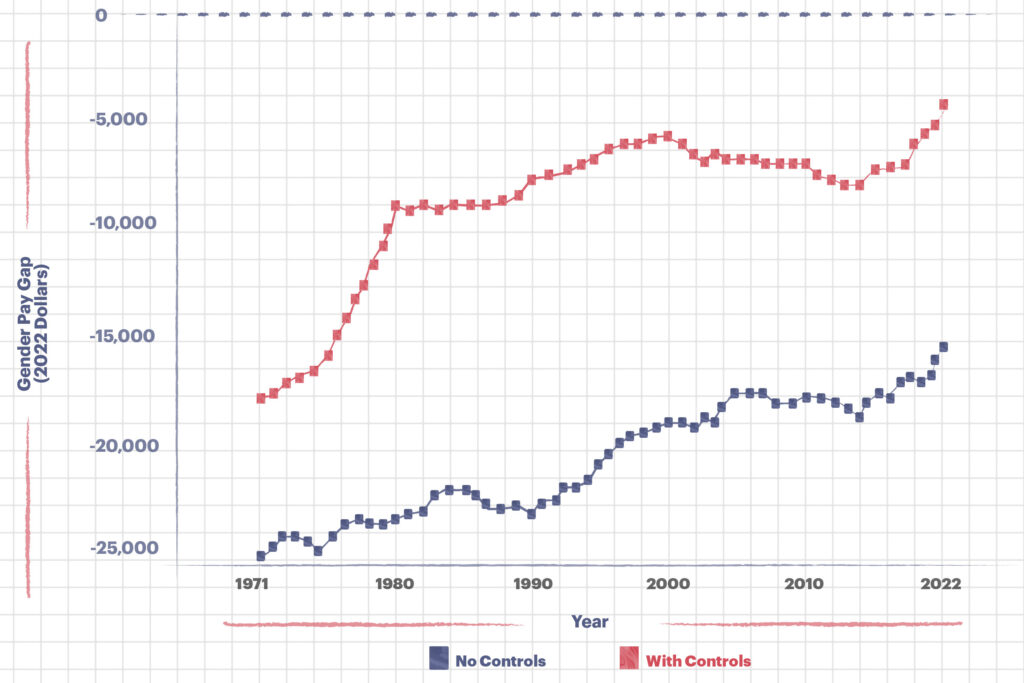
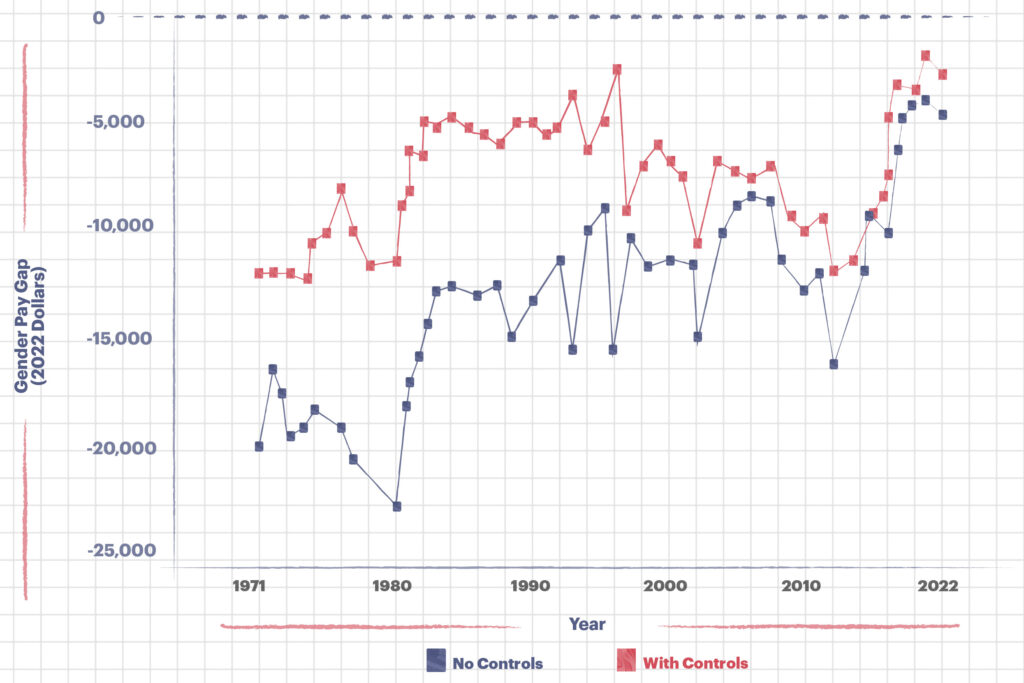
Figure 5: Gender pay gap
The unconditional gender pay gap (no controls) has narrowed over time, from about $25,000 in the early 1970s to about $15,000 in 2022. This means the average salary of women faculty is about $15,000 less than that of men, on average.
The unconditional gap does not account for determinants of pay that vary between men and women. For example, salary usually increases with tenure so the disproportionate share of men in tenured positions (shown in figure 2) would also imply higher salaries for men. Accordingly, figure 5-A also plots the conditional gender pay gap (with controls) that accounts for these observed differences. The controls include institution, department, number of years at the institution, and highest degree obtained.
The conditional gender pay gap has also narrowed over time but remains well below zero. In 2022, women earned about $5,000 less on average compared to their male counterparts in the same positions and at the same institutions as them. The estimates are similar to those reported by Momani, Dreher and Williams from publicly-available data on salaries above $100,000 in Ontario.
Figure 5-B repeats the analysis for new hires. The results are consistent with the finding from the full sample that women earn about $5,000 or less than their male counterparts.
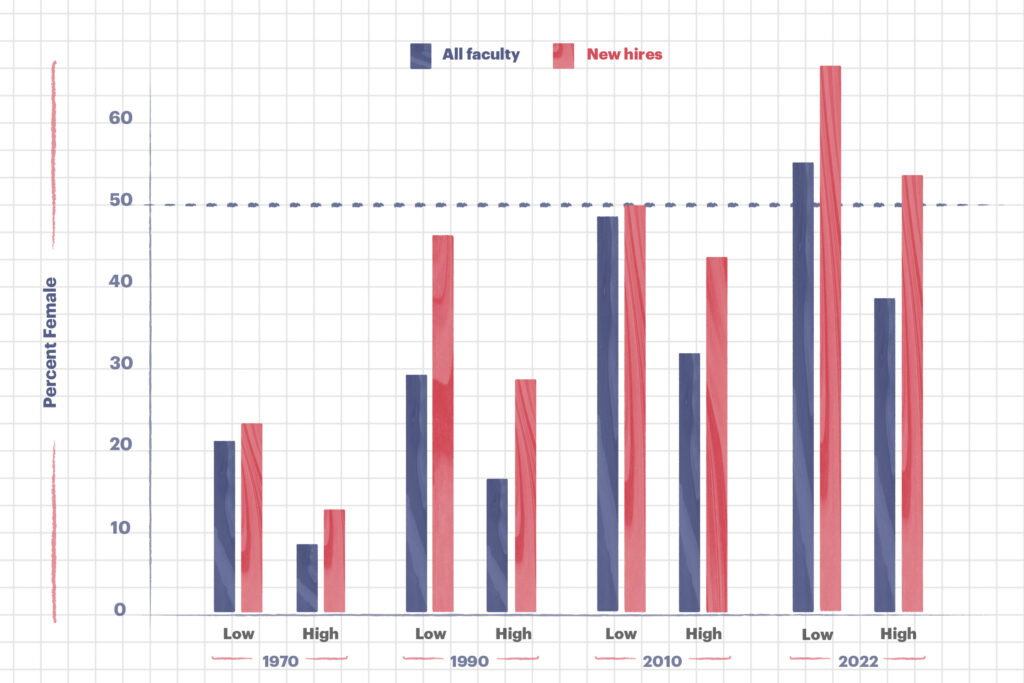
Figure 6: Women’s representation by pay of department
It is worth noting that controlling for observables may be desirable to balance the gender comparison but may also absorb some of the effect that is being investigated. For example, if gender discrimination in hiring leads to women taking faculty positions at lower-paying institutions and departments then there is some justification for omitting these controls.
Women are more likely to work in low-paying departments compared to men, as shown in figure 6. This finding holds for all faculty and new hires. For example, in 2022, women represented 55 per cent of all faculty in low-paying departments compared to only 38 per cent in high-paying departments. The conditional gender pay gaps (with controls) shown in figure 5 are to some extent lower bound estimates of the overall differences in pay between men and women.
Lastly, figure 7 carries out the conditional gender pay gap analysis separately for different groups. Panel A shows that the pay gap remains larger in high-paying departments. This finding suggests a potential strategy for combatting the gender pay gap is to reduce disparities across fields of study. Panel B shows the pay gap was historically large in STEM fields but now resembles the pay gap observed in BHASE fields. Panel C shows that the gender pay gap is the lowest in Atlantic Canada and Quebec and tends to be the largest in the Prairies and British Columbia.
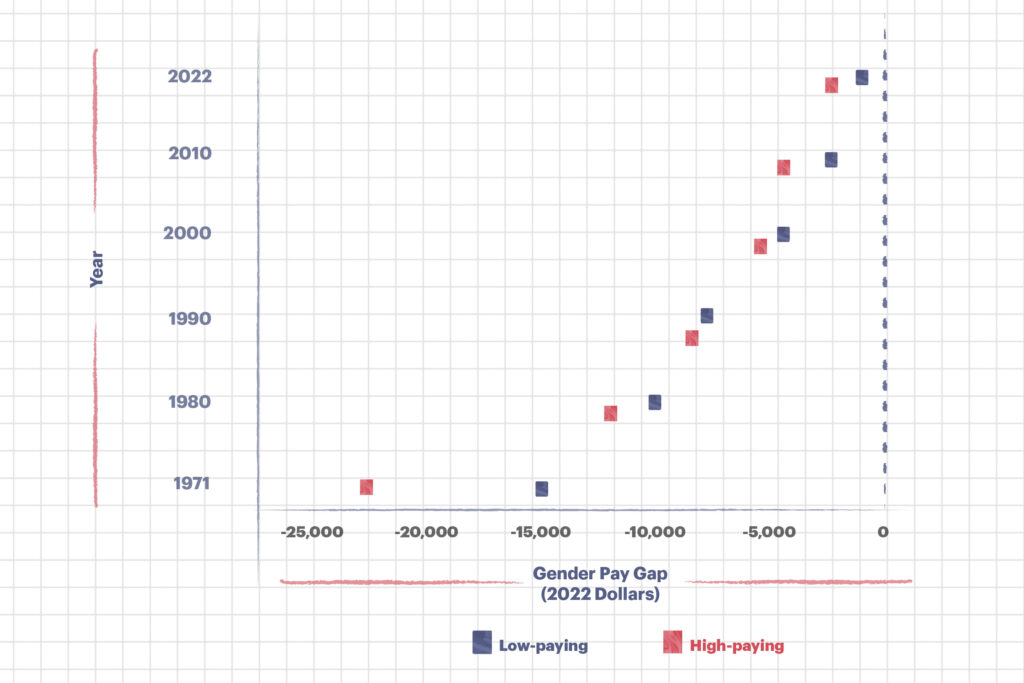

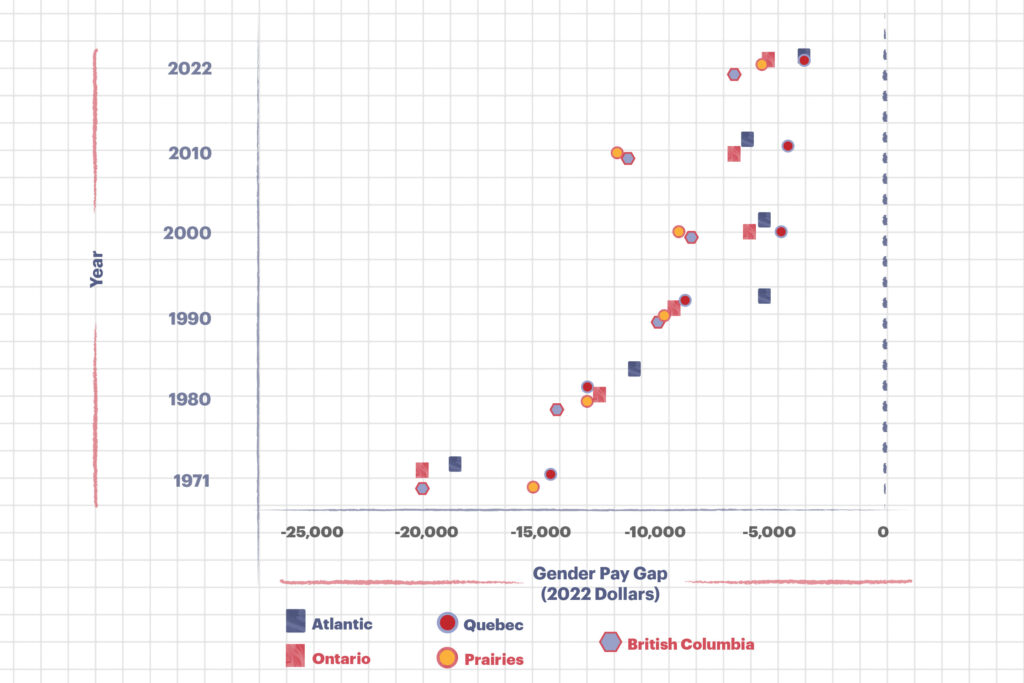
Figure 7: Gender pay gaps for selected groups
Conclusion
The per cent of women in full-time faculty positions reached 42 per cent in 2022. Slightly more than half of all new hires over the past few years have been women — even within STEM fields.
However, women remain underrepresented overall in STEM fields and are less likely to have administrative responsibilities than men. Women are also more likely than men to work in low-paying departments. Estimates suggest that the gender pay gap has improved over time but that women still earn about $5,000 less than their male counterparts in the same positions and at the same institutions.
These gender disparities may continue to improve gradually over time as younger faculty members move through promotion and tenure. However, shorter-term solutions may also exist, such as implementing gender pay equity adjustments as some institutions have done (Table A2 in Baker et al., ) and reducing pay disparities across departments.
More from Features
-

Flight of the Valkyrie
Waterloo engineering students compete for glory with an AI-enhanced urban firefighting drone.
-

Behind the curve
Learning to embed AI in the medical curriculum.
-

The grey area of artificial intelligence
As AI transforms university practices, legal and ethical challenges are multiplying.
-

The King and AI
A team of international scholars tackles a historical work of epic proportions.
More from Equity
-

Q&A with Canada’s former special representative on combating Islamophobia
Amira Elghawaby champions religious accommodations on campus.
-

Fourteen women receive engineering scholarships in commemoration of 1989 Montreal massacre
Initiated by Polytechnique Montréal in 2014, the scholarship program has vastly expanded its support for female engineering students.
-

The Mintz Report is wrong on EDI
Demanding ‘institutional neutrality,’ Alberta’s report on the post-secondary system risks silencing equity.
-

The Scarborough Charter and addressing anti-Black racism among francophone postsecondary institutions in Quebec
Under the charter, Canadian postsecondary institutions pledge to establish frameworks to eliminate anti-Black racism from their campuses.
Post a comment
University Affairs moderates all comments according to the following guidelines. If approved, comments generally appear within one business day. We may republish particularly insightful remarks in our print edition or elsewhere.